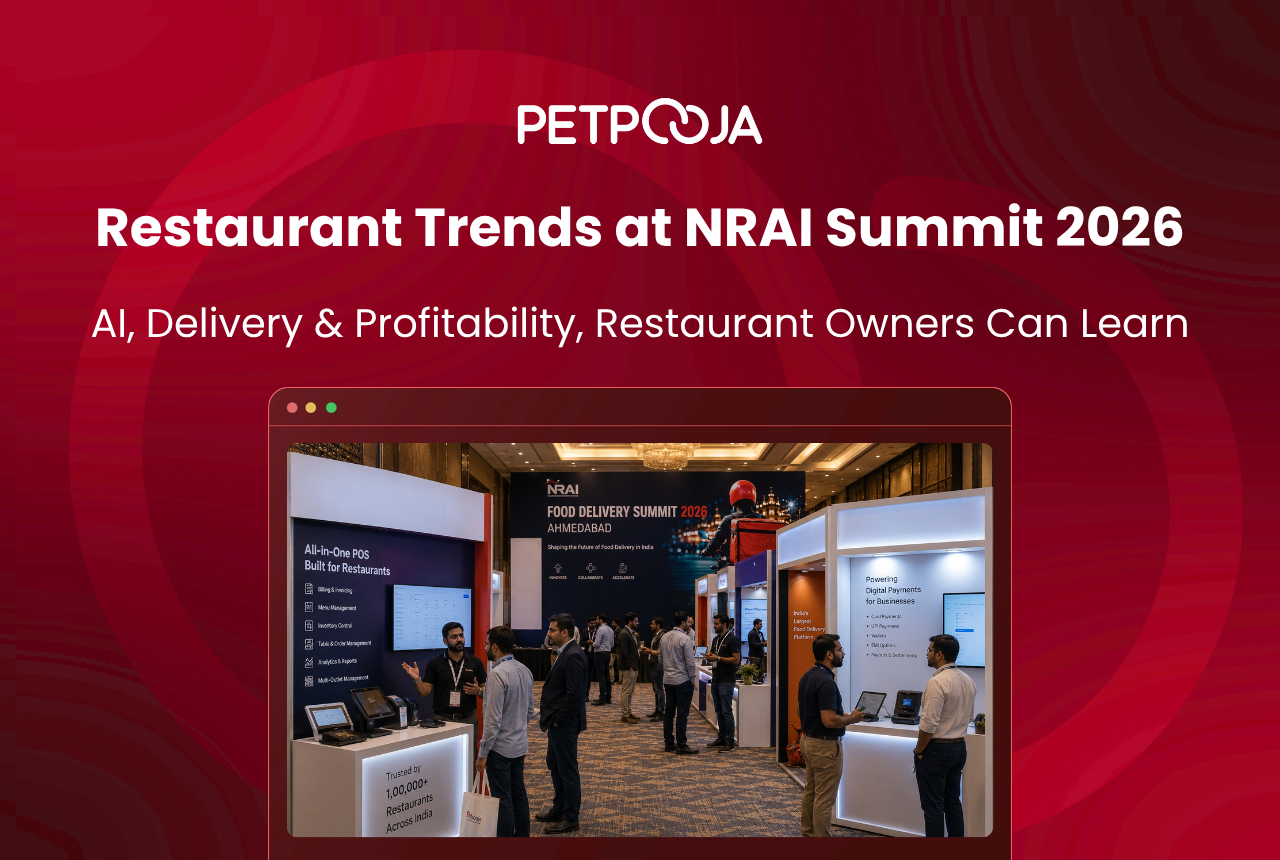
Delivering Growth Through Technology is the theme of the NRAI Food Delivery Summit 2026 in Ahmedabad. Stripped of the conference language, it makes a specific claim: that software is now a growth lever, not just a record-keeping cost.
That claim is worth testing against your own outlet. This page breaks the theme into the four layers where technology actually moves money in an Indian restaurant, and how to judge which layer to fix first.
Key Takeaways
- The theme translates into four layers: order capture, kitchen throughput, cost control and customer ownership.
- Cost control is the cheapest layer to fix first, because it needs no new customers.
- Tools that were once chain-only now sit inside everyday restaurant software.
- Judge any tool by which number it moves, and whether you currently measure that number.
Why the Industry Picked This Theme
The market is growing and getting harder at the same time. India’s food services market was valued at ₹5,69,487 crore in FY24 and is projected to reach ₹7,76,511 crore by FY28, per the NRAI Food Services Report.
More outlets and more delivery volume mean more data than any owner can read by hand. That is the gap the theme points at. Growth is available, but only to operators who can see their own numbers fast enough to act on them.
The summit’s own campaign puts the second pressure more bluntly: “Are you getting more orders… or just paying more commissions?”
That is the squeeze. Delivery grew the top line for most outlets while thinning the bottom one, because commission, discounts and packaging all come out of the same plate. An owner can be selling more than ever and keeping less.
Technology is the theme’s answer to that squeeze. Not because software adds customers, but because it shows you which orders, dishes and channels are actually paying.
The Four Layers Where Technology Drives Growth
Most technology conversations collapse into a feature list. It helps more to think in layers, because each one moves a different number and each pays back on a different timeline.
The order matters too. Fixing throughput before cost control means serving more orders at a margin you have not measured. Fixing customer ownership before order capture means bringing people back to a menu that is out of sync. The layers below are listed in the order they usually break.
A useful way to read the diagram is to find the layer where your own answer is “I do not know”. That is almost always where the money is going, because a number nobody watches is a number nobody ends up defending.
Layer 1: Owning the Order, Not Just Receiving It
Order capture is where most owners already have technology, and where most of it is only half-used. Orders arrive from Swiggy, Zomato, the phone, the counter and sometimes a website, and each channel keeps its own truth.
The growth comes from collapsing that into one screen. When every channel lands in the same place, price changes propagate, and an out-of-stock dish switches off everywhere at once instead of only where someone remembered.
That last point is not a small saving. Cancelled orders from items that were sold but unavailable damage both margin and rating, and the rating damage outlasts the refund by months.
Owners often treat this as a staff problem. It is usually a systems problem. If switching off one dish means logging into three dashboards during a dinner rush, nobody will do it on the third day. Our guide on item availability controls covers the mechanics, and menu sync across channels covers keeping prices honest.
Layer 2: Throughput as a Growth Lever
Throughput is the layer owners underrate most. You cannot serve more orders in a peak hour by wanting to, but you can by removing the pauses between them.
Those pauses are small individually. A ticket read twice, a dish started late, a table cleared slowly. Across a three-hour dinner service they add up to covers you never served and had the capacity for.
A screen in the kitchen replaces the paper ticket that gets lost, smudged or sequenced wrong. Our comparison of KDS versus paper KOT sets out what changes in practice.
On the floor, the same logic applies to how guests order. Scan and order shortens the gap between a guest deciding and the kitchen knowing, which is where table turnover is won or lost.
Layer 3: Cost Control That Runs on Data
This is the layer to fix first, because it needs no new customers. Every rupee found here is a rupee you already earned and were losing.
Three things sit in this layer. Recipe-level food cost tells you what each dish actually costs to make. Stock tracking shows where it disappears. A clean day-end close confirms what was billed matches what was banked.
The fourth is leakage, and it is the one nobody looks for. Cancels, waivers, discounts and reprints all leave a trace, and the POS leakage panel is where that trace is read.
A staff discount given daily at the same terminal is not theft. It is a habit nobody priced. Habits like that only become visible when someone reads the report.
Read the report weekly, not yearly. A leak caught this month stops costing you; the same leak found at next year’s audit has been running the whole time.
Layer 4: Whether the Customer Is Yours
This is the question the summit keeps returning to. Every order creates data, so who owns it?
When an order arrives through an aggregator, the platform holds the relationship. You get the revenue minus commission, but not the phone number, the order history or the ability to bring that person back without paying again.
The campaign names four things the brands getting this right are investing in.
| What Successful Brands Invest In | What It Means in Practice |
|---|---|
| First-party data | Contact numbers, order history and feedback you hold yourself |
| Loyalty programmes | A reason to order from you directly rather than through an app |
| Direct communication | A channel to reach that customer without paying for the reach |
| Customer retention | Measuring who came back, not just who ordered once |
The campaign names three outcomes from getting those four right: better relationships, higher repeat orders and sustainable growth.
Loyalty programmes are where most Indian outlets start, because they work without a marketing team. This is the slowest layer to pay back, and the only one that compounds.
Where AI Actually Fits
AI is the word doing most of the work in “technology” this year, so it is worth being concrete about where it earns anything.
The useful applications are unglamorous. Sales forecasting turns prep from a guess into a number. Invoice scanning removes typing. Payout matching catches short settlements. None of it is the AI anyone demos on stage.
None of it replaces judgement. It clears the counting so the judgement has better inputs.
The test for any AI feature is the same as for the rest: does it touch a number you already track? A forecast is useful because you can check it against what actually sold. A recommendation with nothing to check it against is just a confident opinion.
How to Judge Whether a Tool Is Worth It
Use one test: which number does it move, and do you currently measure that number?
| Layer | The Number It Moves | Ask Before You Buy |
|---|---|---|
| Order capture | Revenue captured, cancellation rate | Do I know my cancellation rate this month? |
| Throughput | Orders cleared per peak hour | Do I know how many orders my kitchen clears at 8 PM? |
| Cost control | Food cost percentage, margin kept | Do I have recipe-level costs, or only purchase totals? |
| Customer ownership | Repeat order rate | Do I know how many of last month’s customers came back? |
If your answer is no, start by measuring. You cannot judge a tool against a number you never tracked.
Then ask a second question. How many people have to change what they do? A tool that needs your whole floor team to learn a new habit mid-rush usually fails.
Here is that going wrong. An owner in Vastrapur buys a loyalty module without knowing their repeat rate (an example, not a real business). Six months on, they still cannot say if it worked.
Get the easy numbers first. Our food cost calculator gives you food cost in minutes. The profit margin calculator sets your margin baseline.
Where to Start If You are Behind
The order below is deliberate. Each step funds the next.
- Measure before you buy. Pull food cost percentage, cancellation rate and repeat rate from what you already have. The restaurant P&L template gives you somewhere to put them.
- Fix cost control. It needs no new customers and usually surfaces leaks within a month.
- Then fix order capture. Once margin is protected, capturing more orders is worth more per order.
- Then throughput. More orders only helps if the kitchen can clear them.
- Then customer ownership. This is the slowest to pay back and the most durable.
Most of these sit in one system rather than four. Petpooja POSS covers all four layers on one platform, with AI running underneath it: demand forecasting that sets your prep numbers, invoice scanning that reads a photo instead of asking you to type, and payout matching that flags a short settlement before you notice it.
It processes 60 lakh bills a day across 1,00,000+ restaurants, so the forecasts learn from real Indian volume rather than a demo dataset.
Conclusion
“Delivering Growth Through Technology” is not really a claim about software. It is a claim about visibility. Operators who can see their own numbers weekly make better calls than operators who see them at the accountant’s office in July.
The theme runs across 15+ sessions at the NRAI Food Delivery Summit 2026 in Ahmedabad on 20 August, with 70+ speakers. Prices and offers change, so check the official website for the updated price before you register for the summit.
Frequently Asked Questions
It is the theme of the NRAI Food Delivery Summit 2026. In practice it means using software to grow revenue rather than only to record it, across four layers: how orders are captured, how fast the kitchen clears them, how tightly costs are tracked, and whether the customer belongs to you or the aggregator.
Cost control, because it needs no new customers to show a result. Recipe-level food cost and a clean day-end close usually surface leaks in the first month, and the gain funds whatever you do next.
No. The tools that used to be chain-only now sit inside everyday restaurant software, so a single outlet gets the same forecasting and stock alerts a 20-outlet group does. The difference is how much time each saves.
Ask which number it moves and by how much, then check whether you measure that number at all. A tool that improves something you do not track cannot be evaluated, so measure first.
At the NRAI Food Delivery Summit 2026 in Ahmedabad on 20 August, across 15+ sessions with 70+ speakers. For the term behind most of these conversations, see our glossary entry on the kitchen order ticket.