
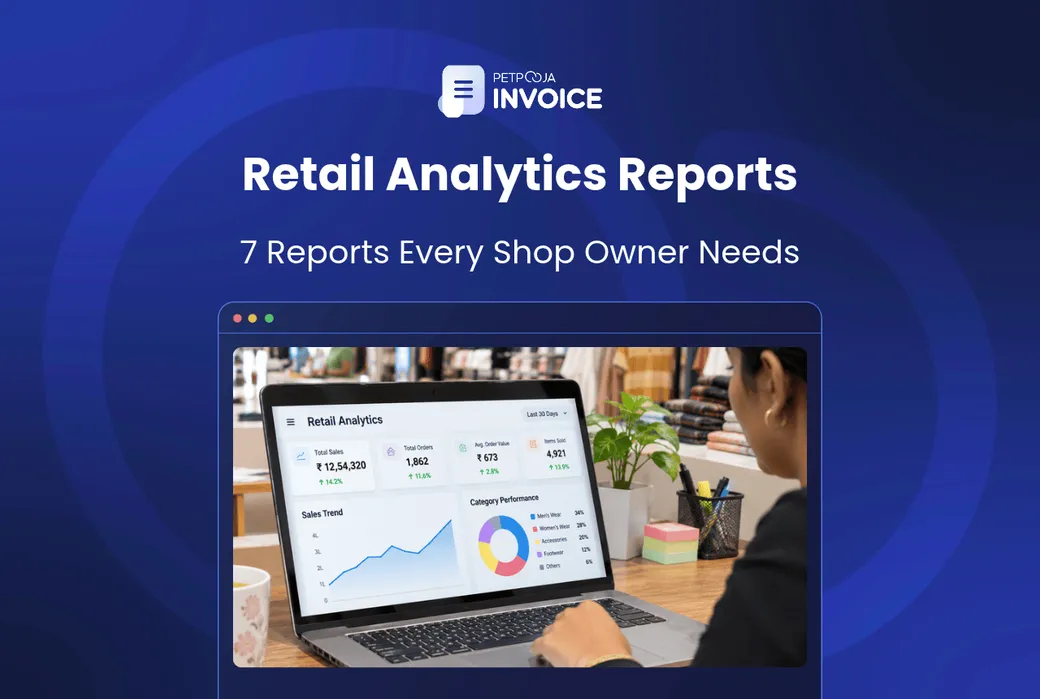



Which retail analytics reports should a small shop track? Seven reports cover what most small shops need to watch. They are daily sales, the day-end payment report, item-wise sales, stock, customer dues, profit by item and GST summaries. Most of them come out of the billing software at your counter.
How much they help depends on two things. The first is how often you open each one. The second is whether every sale and every purchase is in the system. A report built on half the bills tells you half the story.
This post is for small Indian business owners and shop owners. For each report, it covers what it shows, when to read it, one warning sign and one action. Then come a reading schedule, the setup that keeps the numbers right, and the software that builds the reports for you.
Key Takeaways
- Seven retail analytics reports cover what most small shops need to watch, and reading each on its own schedule catches a problem while it is still small.
- Unsold stock is cash you cannot spend. The stock report, read beside item-wise sales, shows where it sits.
- A sale skipped at the counter throws sales, stock and profit off together.
What Is Retail Analytics for Small Indian Retailers?
Retail analytics is reading your own shop’s sales, stock and payment data. You use it to decide what to buy, what to charge and whom to chase for money.
For a small shop, that is not a data team or a dashboard project. It is a handful of reports in your billing software, read on time. Read that way, they show you which stock to cut, which customers to chase and where cash is leaking, before the month ends.
Here is a simple case (an example). Your item-wise report shows a ₹10 pen selling 75 a week, and the stock report shows 40 left. That tells you to reorder today, before the box runs out on a busy afternoon.
Types of Retail Analytics in Shop Terms
Analytics is often split into four types. In a shop, each one is a question your reports answer.
- Descriptive: what happened. The daily sales, payment-mode and GST reports.
- Diagnostic: why it happened. Comparing today with a week ago, or profit against sales.
- Predictive: what comes next. Item-wise sales and the stock report help you predict what will run out or sit unsold.
- Prescriptive: what to do next. The action under each report below is this kind of analytics.
7 Retail Analytics Reports for Shop Owners
These seven reports run from the ones you open every night to the ones you open once a month. Each one below says what the report shows, when to read it, one warning sign and one action.
The 7 reports:
- Daily sales report (every night)
- Payment-mode and day-end report (every night)
- Item-wise sales report (weekly)
- Stock report (weekly)
- Customer dues report (weekly)
- Profit by item and profit and loss (P&L) report (monthly)
- GST reports for your accountant (monthly)
This post is about which report to open and when. Retail key performance indicators (KPIs) and their formulas are a separate topic. Only two formulas appear here, where a report needs them.
1. Daily Sales Report
The daily sales report shows what the shop sold today. It gives the total sales, the number of bills and, in many billing tools, the average bill value. Read it every evening at closing time. It takes a few minutes.
In Petpooja Invoice, this sits in the Detailed Sales Reports.
The one formula worth knowing here is simple:
Average bill value = total sales ÷ number of bills.
Take a mobile accessories shop in Rajkot (an example). On a Saturday in October 2026 it sells ₹38,640 across 92 bills. That is an average bill of ₹420. Last Saturday, it sold ₹41,170.
Saturday, closing time Total sales ₹38,640 Number of bills 92 Average bill ₹420 Same day last week ₹41,170 The four numbers to read on a daily sales report, from a mobile accessories shop in Rajkot (an example). Green: the average bill, total sales divided by bills. Amber: the number to compare against.Sales fell by ₹2,530 against last Saturday. Before you worry, check whether fewer people came in or each one spent less.
- Warning sign: sales sit below the same day last week three weeks running. One slow Saturday can be chance, but three in a row is a pattern.
- Action: compare each day with the same weekday last week, not with yesterday. A Saturday and a Monday rarely look alike.
2. Payment-Mode and Day-End Report
The payment-mode report splits the day’s sales by how customers paid: cash, Unified Payments Interface (UPI), card or credit. Read it every night at closing, right after the daily sales report.
The Rajkot mobile accessories shop from report 1 (an example) splits Saturday’s ₹38,640 into ₹14,820 cash, ₹21,360 UPI and ₹2,460 card. The cash drawer holds ₹14,320, so the counter is ₹500 short.
- Warning sign: cash in the drawer does not match cash in the report, again and again on the same staff member’s shift.
- Action: count the drawer against the report before you lock up. The next morning, match the UPI and card totals with your bank, as our bank reconciliation steps explain.
3. Item-Wise Sales Report (Fast and Slow Movers)
The item-wise sales report lists every item with the quantity and value sold over a period. Sort it by quantity, and the fast movers rise to the top while the slow movers sink to the bottom. Read it once a week, before you place your orders.
Picture a stationery shop in Kolhapur reading four weeks of sales (an example). Ball pens sold 312, A4 notebooks 186 and glue sticks 74. Geometry boxes sold 11, and fountain pen ink sold 3.
Ball pens 312 sold A4 notebooks 186 sold Glue sticks 74 sold Geometry boxes 11 sold Fountain pen ink 3 sold Four weeks of item-wise sales at a stationery shop in Kolhapur (an example), with bars drawn to scale. Green: fast movers to reorder first. White: in between. Amber: slow movers to check in the stock report before reordering.Glue sticks sit in the middle at 74, so they need no change yet. The two amber rows are where money is likely to be stuck.
- Warning sign: a fast mover shows zero sales for a few days. That usually means it ran out, not that demand stopped.
- Action: reorder the top movers before they run out. Items near the bottom are likely to be stuck, so check them in the stock report before you reorder any more.
4. Stock Report (What Is Left and Dead Stock)
The stock report, also called an inventory report, shows how much of each item is left and what that stock is worth. Dead stock is stock that has stopped selling, so it ties up cash and shelf space. Read it every week, and check a few shelves against it whenever you can.
If your stock report shows the last sale date, sort by it. If it does not, put it beside the item-wise sales report and look for items with stock but no sales. Those items also drag down your inventory turnover ratio, the measure of how fast stock moves overall.
In Petpooja Invoice, this sits in the Inventory Related Reports, with real-time stock tracking behind them.
Say a garment shop in Vastrapur, Ahmedabad, has 40 kurtas that have not sold since August 2026, bought at ₹310 each (an example). That is ₹12,400 sitting on a shelf.
- Warning sign: the stock report says 18 pieces, but the shelf holds 14 (an example). A gap like that grows if no one checks it.
- Action: clear dead stock before the next season by marking it down or bundling it. To keep the count honest, check a few items each week instead of the whole shop once a year. Cycle counting shows how to do this without closing.
5. Customer Dues Report
The customer dues report lists who owes you money, how much and since when. This is the udhaar book, kept inside your billing software instead of a notebook under the counter. Read it every week, on the same day each time.
In Petpooja Invoice, Due Management and the accounts receivable and accounts payable (AR/AP) Reports show what customers owe you and what you owe suppliers.
Picture a hardware shop in Hubballi with ₹1,86,500 owed by 23 customers, and ₹74,200 of it older than 60 days (an example). The older a due gets, the harder it is to collect.
- Warning sign: one customer’s dues keep growing while they keep buying on credit.
- Action: call the oldest dues first, not the biggest. Set a credit limit per customer, and stop fresh credit once someone crosses it.
6. Profit by Item and P&L Report
A profit by item report shows what you earned on each item after its purchase cost. The profit and loss (P&L) report then takes the whole shop, with rent, salaries and other costs taken off. Read both once a month.
In Petpooja Invoice, the shop-wide view is the Profit and Loss Report.
The second formula in this post is the margin on one item:
Margin % = (selling price − purchase cost) ÷ selling price × 100.
A phone cover sells for ₹249 and costs ₹180 to buy (an example). The margin is ₹69, which is about 27.7% of the selling price.
- Warning sign: sales rise month on month, but profit stays flat. Often a best seller has a thin margin, or a supplier raised the price and your selling price did not move.
- Action: check that the latest purchase price is entered for your top 20 items. Then decide item by item whether to change the price or the supplier. Our retail profitability template gives you a format for the monthly check.
7. GST Reports for Your Accountant
GST reports pull your sales and purchases into the shape your accountant needs to file returns. GSTR-1, a GST return form, is where you report your sales. Sales to other businesses go in bill by bill.
GSTR-3B is the summary return where the total tax is reported and paid. It is also where you claim input tax credit (ITC), the GST you already paid on purchases.
Your accountant files both on the GST portal. In Petpooja Invoice, the GSTR-1 and GSTR-3B reports sit beside the GSTR-2 and purchase reports. That puts your sales-side and purchase-side GST in one place. The GSTR-2 return is no longer filed, so use that report as a purchase summary for your accountant.
Read these once a month, before you send the data to your accountant.
Check one thing first. Every business-to-business (B2B) bill should carry the buyer’s GST Identification Number (GSTIN). It also helps to give every item its Harmonised System of Nomenclature (HSN) code, so the GST summaries group cleanly.
- Warning sign: the month’s sales in the GST report do not match the month’s daily sales reports added up. Often a bill was edited or cancelled after the day closed.
- Action: find and fix the gap before you export the data, not after the return is filed. If your current software cannot give these reports, our list of GST billing software compares five options.
Report names and layouts differ by software, so check which of these seven yours gives you.
How Often to Read Each Retail Analytics Report
Two of the seven retail analytics reports are daily, three are weekly and two are monthly. The table puts them on one schedule, with the one number to look at first in each.
| Retail Report | How Often to Read It | First Number to Check |
|---|---|---|
| 1. Daily sales report | Every day at closing | Total sales against the same day last week |
| 2. Payment-mode and day-end report | Every day at closing | Cash in the report against cash in the drawer |
| 3. Item-wise sales report | Weekly, before ordering | Top movers by quantity |
| 4. Stock report | Weekly | Items with stock but no sales |
| 5. Customer dues report | Weekly, on the same day | Dues older than 60 days |
| 6. Profit by item and P&L | Monthly | Margin on your top 20 items |
| 7. GST reports | Monthly, before your accountant files | Sales total against the daily reports |
A fixed day matters more than the exact schedule. Put the weekly ones on the day you place orders. Add them to your daily operations checklist so they happen even on a busy week.
Set Up Your Data So Retail Analytics Reports are Right
Retail reports are right only when the item list is clean and every sale and purchase is entered. Do these five things in order before you rely on any report.
- Clean the item list. One item, one name. “Blue pen 0.7” and “Pen blue” as two items split the sales between them.
- Group items into categories. Pens, notebooks and art supplies, or shirts, kurtas and denims. Give every item a category, so category-level views add up.
- Scan, do not type. A barcode scan picks the right item, so stock moves on the right item with each sale.
- Bill every sale. A sale given on a handwritten slip never reaches the report, and the stock count drifts with it. A standard operating procedure (SOP) for billing keeps counter staff on track, and our billing SOP checklist gives you one to start from.
- Enter every purchase with its cost. Without the purchase price, the profit report has nothing to subtract.
Here is how a barcode scan links to the stock report. A stationery shop in Kolhapur (an example) enters a purchase of 200 A4 notebooks. Each scan at the counter takes one off stock. After 186 are sold, the system shows 14 left without a manual count.
What I could recommend from my end. Once the setup is done, take yesterday’s last bill and find it in three reports: sales, stock and GST.
If it shows up correctly in all three, your billing and your reports are joined up. If it is missing from one, find out why that bill did not reach it before you trust the numbers.
How Petpooja Invoice Helps With Retail Analytics
Petpooja Invoice helps with retail analytics by building your reports from the bills you already print and the purchases you enter. Its top feature for analytics is that sales, stock, dues, profit and GST reports all sit in one system, fed by the same bills and purchase entries.
That one-system link is what saves the work. A barcode scan at the counter adds the item to the bill and takes it off stock, and the GST report is built from that same bill. Petpooja Invoice’s AI Inventory Agent keeps inventory levels updated without manual entry, so the stock report reflects every item scanned.
Here is where the reports in this post sit, by the names Petpooja Invoice lists on its product page:
- Daily sales and item-wise sales: Detailed Sales Reports, plus business intelligence reports with category and product level insights
- Stock: Inventory Related Reports, with real-time stock tracking
- Customer dues: Due Management and AR/AP Reports
- Profit: Profit and Loss Reports, with Purchase Reports for your costs
- GST: GSTR-1, GSTR-3B and GSTR-2 reports for your accountant
For the payment-mode split, ask to see it in a demo.
It is the best choice for retail businesses for three reasons. It is made for retail businesses, with billing and stock in one place, and 8,000+ businesses already use it. It covers the GST work an Indian shop has, with e-invoices, e-way bills and Tally integration for your accountant. And the Owner Mobile App lets you read the numbers from your phone, away from the counter.
Conclusion
Retail analytics for a small shop comes down to seven reports. Daily sales and the day-end report come every night. Item-wise sales, stock and dues come every week, and profit and GST once a month.
Start with the two nightly reports tonight: daily sales, then the day-end payment report. Then add the weekly ones on the day you place orders, and the monthly ones before your accountant files.
For small Indian business owners and shop owners, these reports are only as good as the bills behind them. Petpooja Invoice builds most of these reports from the bills you scan at the counter and the purchases you enter, so book a demo to see them.
FAQs
Can I Track Retail Analytics in Excel Instead of Billing Software?
Yes, if you are willing to enter every sale by hand. Our daily sales report template is a good start. The catch is time. A sheet has to be filled in every night, while billing software builds the report from the bills you already print.
How Do I Compare Reports Across Two Shops?
Read each shop’s daily sales report on its own first, then put the totals side by side. Our multi-location sales template gives you a format. Compare the same weekday at both shops, not a total for the week.
Why Is My Stock Report Off After Customer Returns?
A return only goes back into stock if it is entered in the billing software. If the counter hands back cash and puts the item on the shelf, the report still counts it as sold. Unrecorded returns are one of several retail inventory mistakes that leave the count off.
Do I Need a Stock Template if I Already Use Billing Software?
Not for daily work, since the software keeps the count. A stock inventory template still helps for a one-time opening count before you start billing.
Thanks. This helps us make the next article better.

Ashwiniba Vaghela is Senior Executive – Content at Petpooja and the editorial reviewer, which means she also helps in reviewing blogs. She writes the explainers and comparisons people read before they know what to search for: what a category actually is, what it costs to keep doing the job by hand, and which differences between two tools matter once you are running a business rather than evaluating one. Much of her work is built on Petpooja's own numbers rather than borrowed industry reports, and with 1,50,000+ businesses, the patterns in that data answer questions no public survey covers. If you are trying to understand something before you commit money to it, Ashwini is writing for you, and if you have read anything else on this blog, she has already checked it.

Comments
Loading comments…